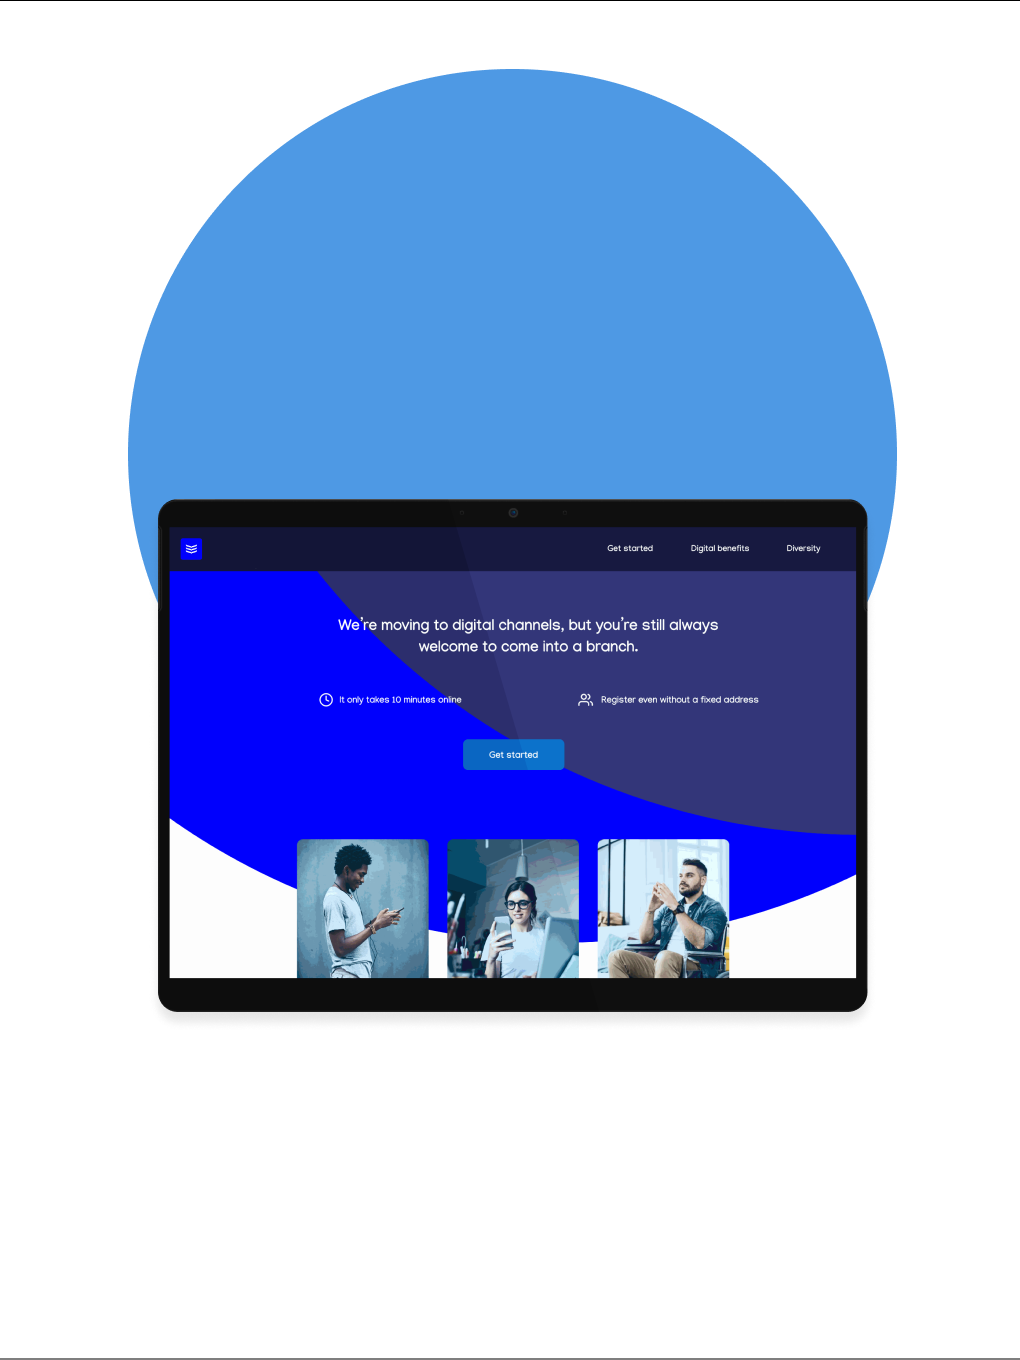
✅ User testing ✅ Figma prototypes ✅ Design system ✅ Journey mapping
Challenge
Scope, design and test new propositions that expanded the range of services across native and web apps while consolidating visual design and interaction patterns.
83%
Increase in UT completion rate
71%
Decrease in UT costs
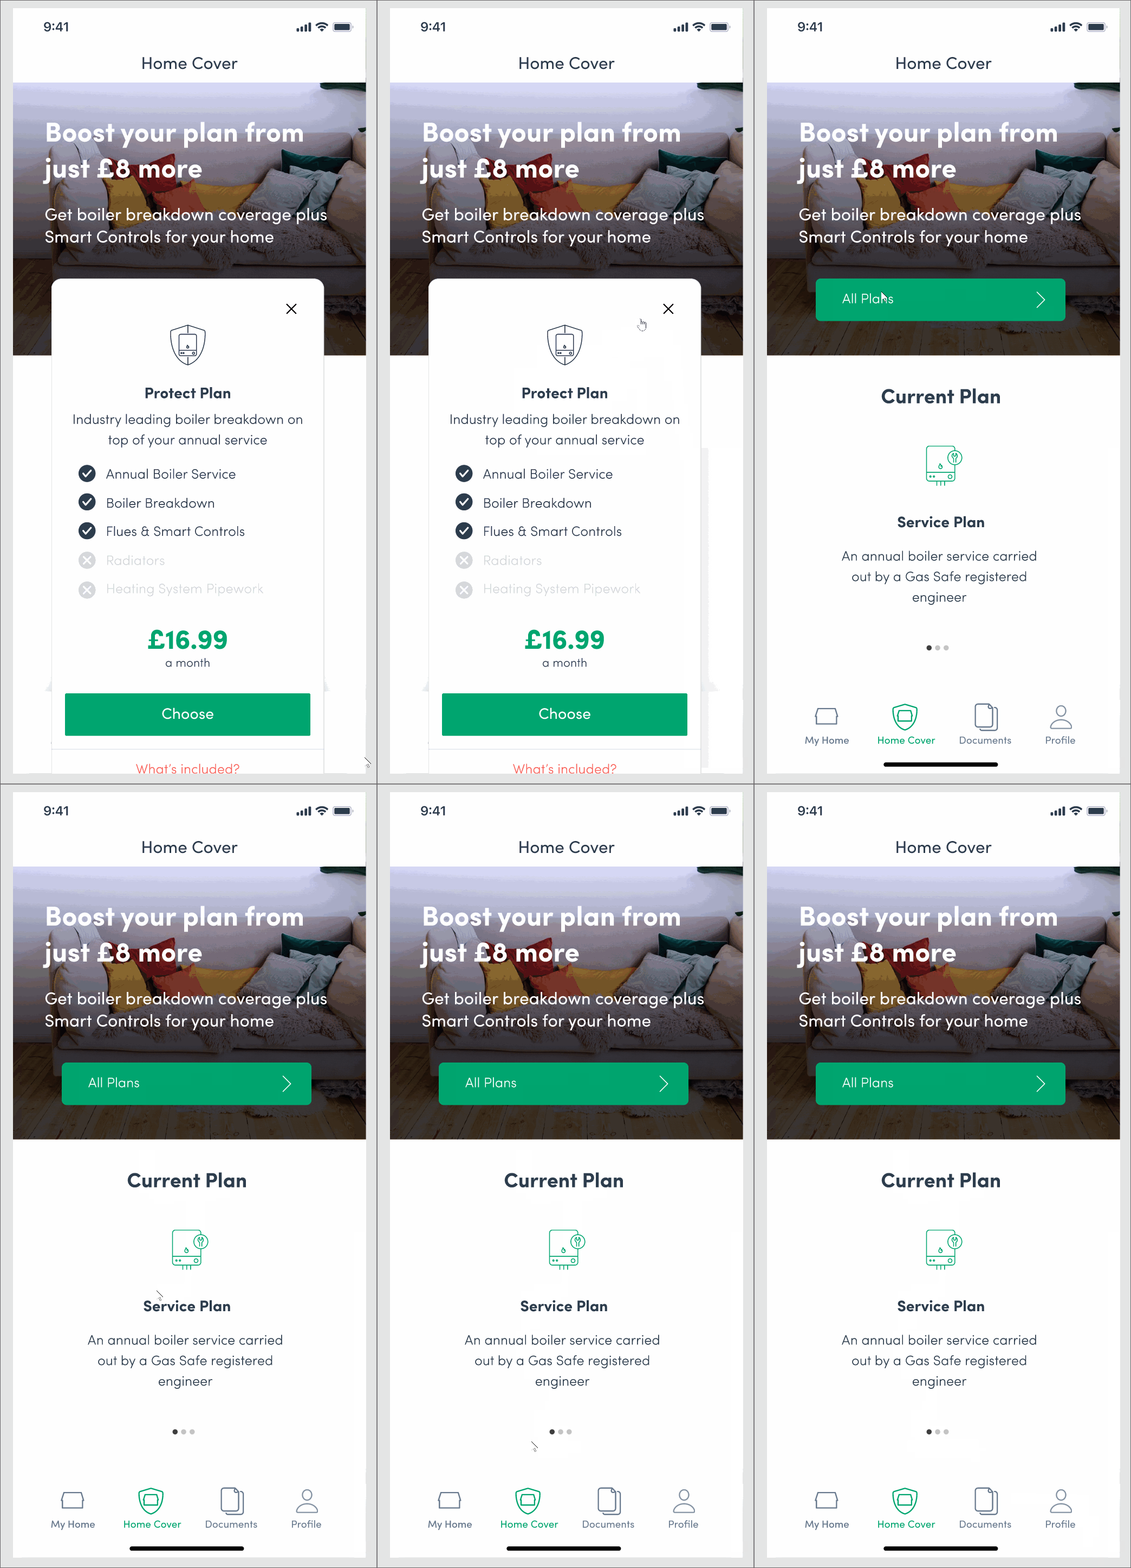
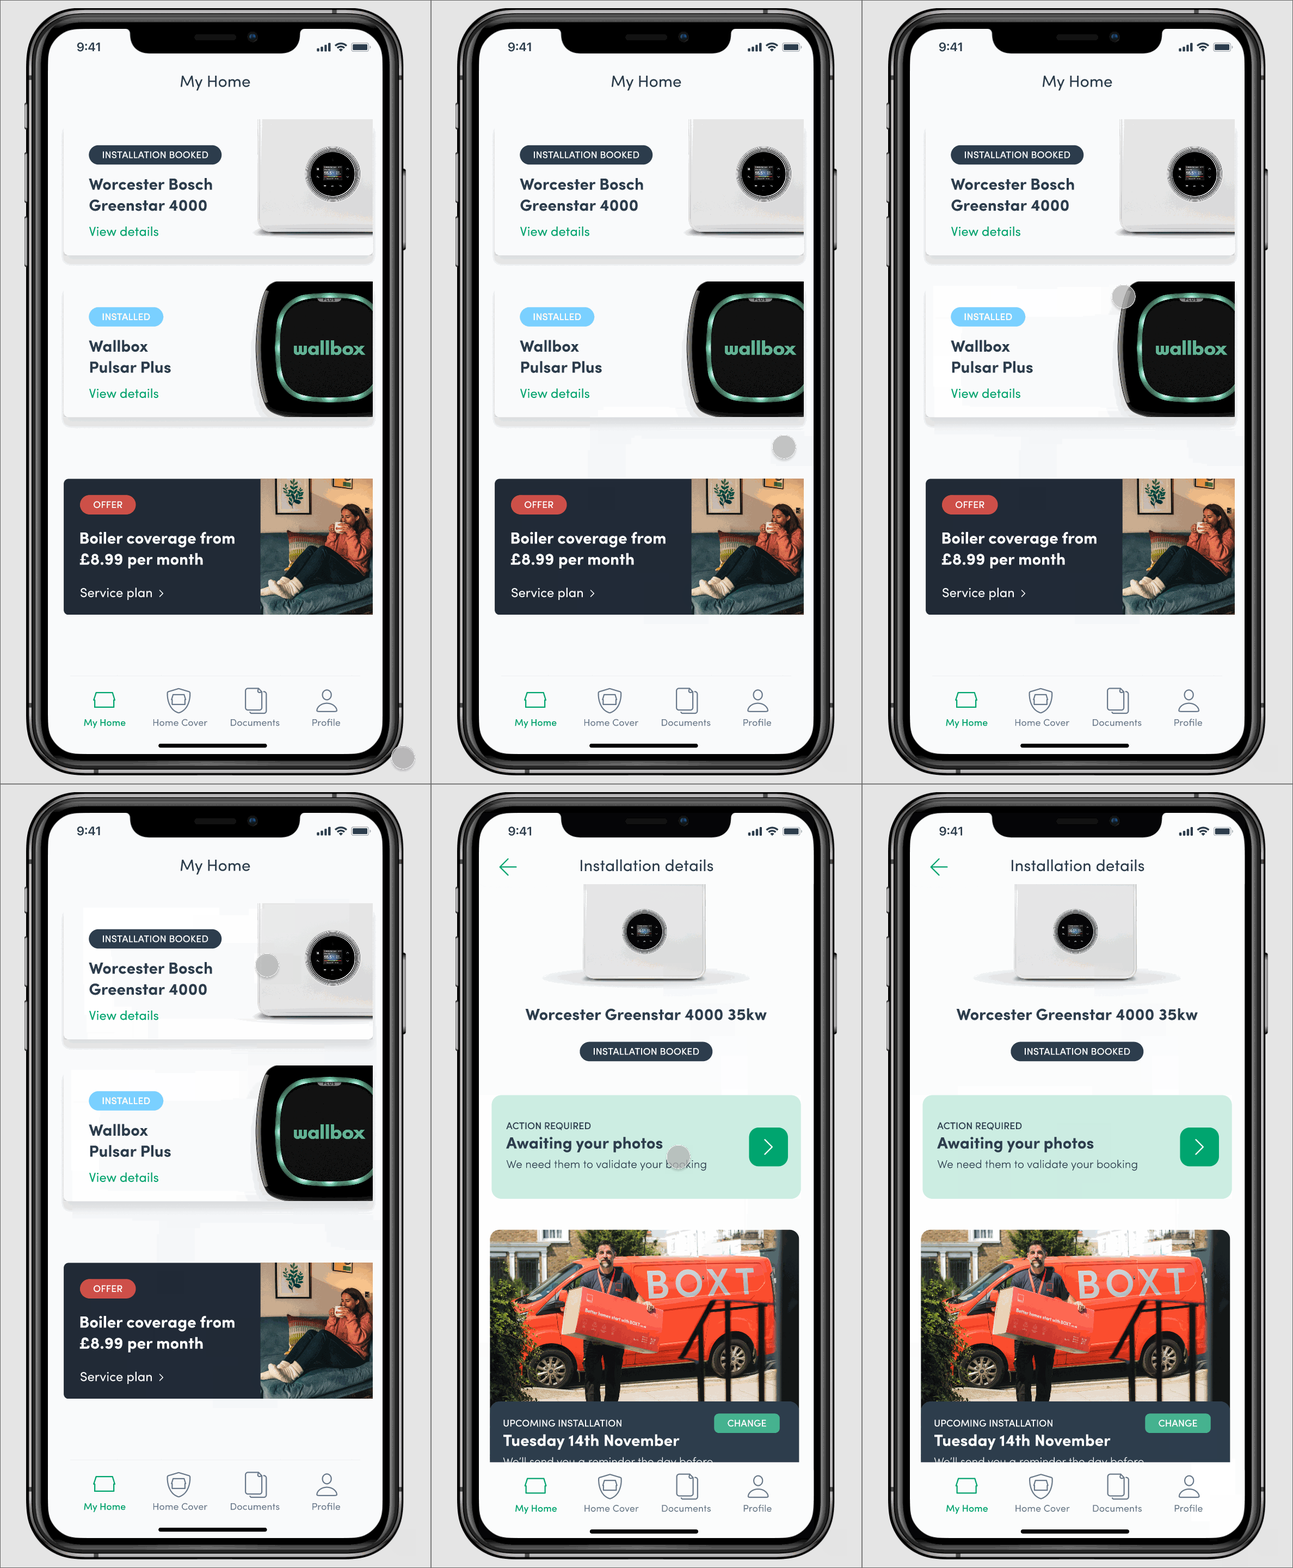
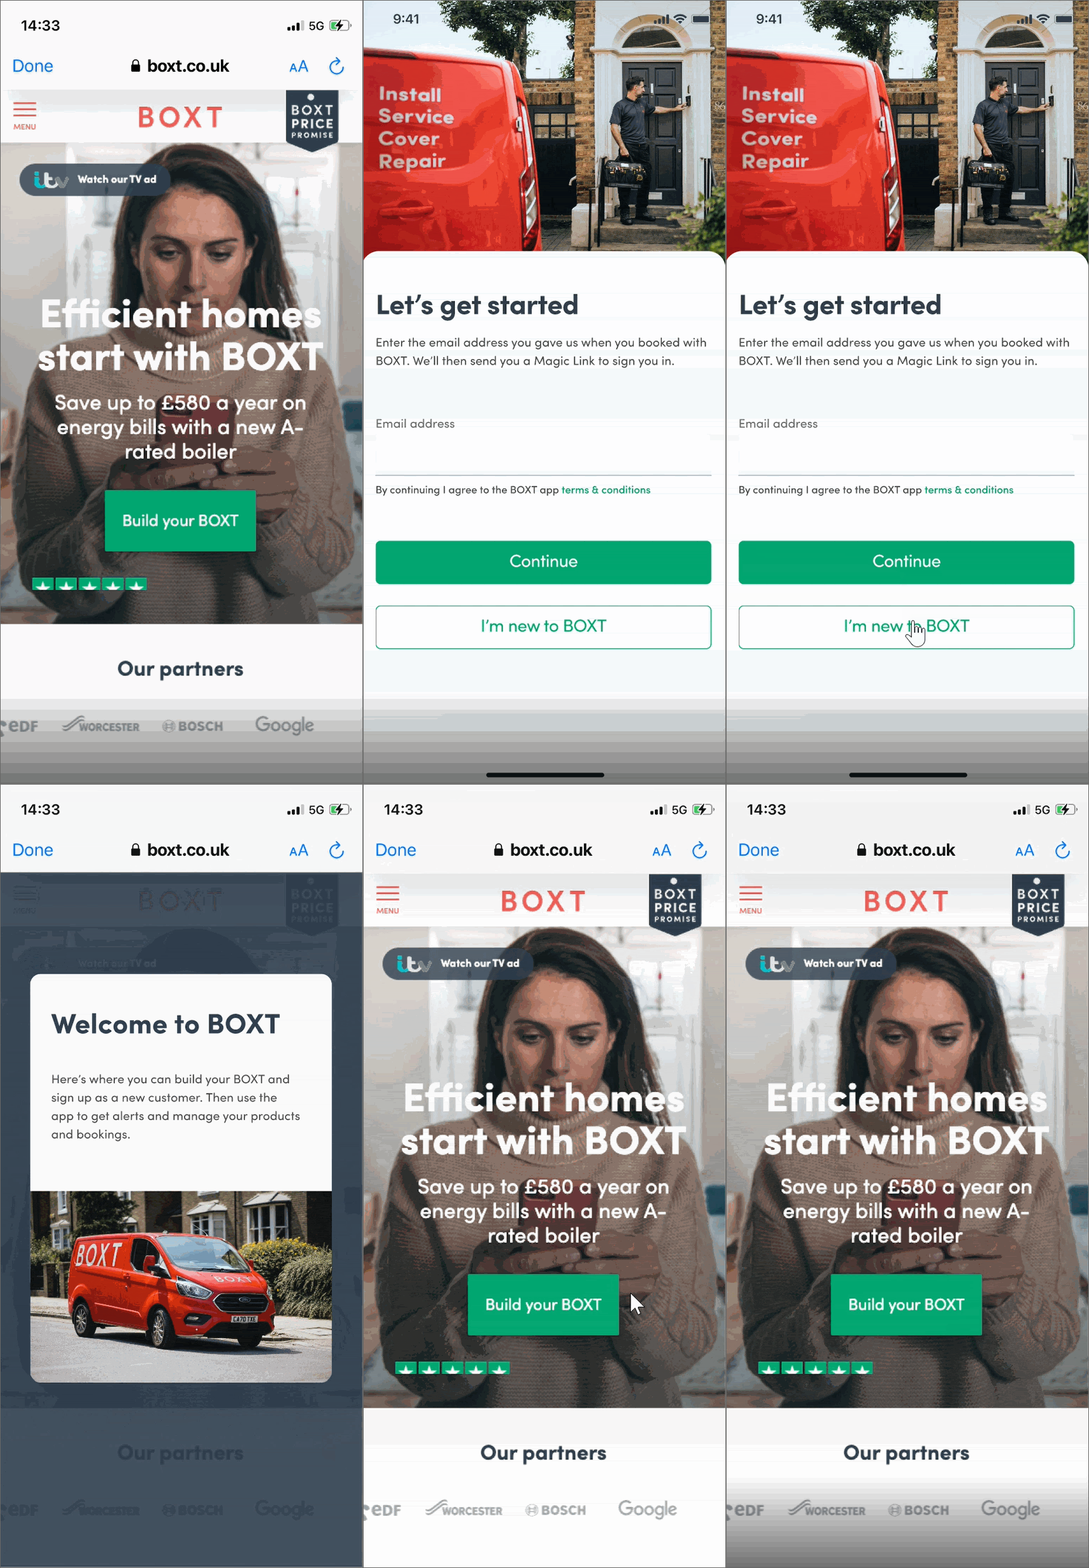
Research
Due to unreliable data and noticing undue overheads from running moderated sessions, I pivoted the team into unmoderated studies with a wider demographic, getting us results in hours (not weeks) and, at a reduced cost.
You need to be able to roll-up the UT data rapidly, or UR gets seen as a blocker
Working with data from the Operations team we mapped the various consumer experiences around boiler installations including pre-purchase, active and post-purchase phases to see where the friction and opportunity lies.
Mapping the user service journey, not just in task flows but emotions too
KPI's, measuring design impact
Collaborating closely with the leadership and product teams, we co-defined KPI's giving us criteria to measure the user testing against.
Collaborating closely with the leadership and product teams, we co-defined KPI's giving us criteria to measure the user testing against.
Without KPIs how can we know what success looks like?
High level wireframes for the consumer native app
High fidelity UI's, based on the wireframes
A much smoother installation experience, for both the customer and service-technician
